Your portfolio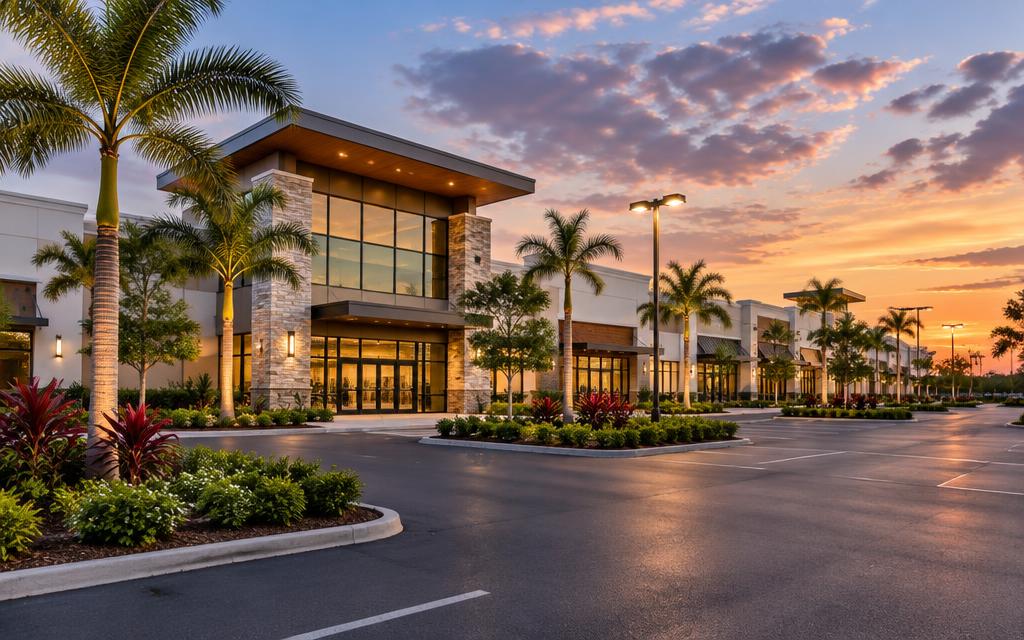
RetailDemo data
Bayshore Commons
2200 S Dale Mabry Hwy, Tampa, FL · Updated Nov 2, 2026
T12 NOI
$1,490,925
Nov 2025 – Oct 2026
Leased
93.1%
100,600 of 108,000 SF
DSCR
1.91x
T12 NOI ÷ annual DS
Est. value
$21.30M
At 7.00% cap assumption
Est. equity
$11.42M
LTV 46.4%
| Line item | T12 Oct ’24Actual | T12 Oct ’25Actual | T12 Oct ’26Actual |
|---|---|---|---|
| Rental income | $1,484,062 | $1,523,955 | $1,571,203 |
| Reimbursements | $558,143 | $567,839 | $591,597 |
| Other operating income | $26,909 | $24,481 | $27,227 |
| Total operating income | $2,069,114 | $2,116,275 | $2,190,027 |
| Operating expenses | −$659,571 | −$671,030 | −$699,102 |
| Net operating income | $1,409,543 | $1,445,245 | $1,490,925 |
| Debt service (P&I) | −$781,222 | −$781,222 | −$781,222 |
| Capital expenditures | −$280,293 | $0 | −$427,647 |
| Cash flow after DS & capex | $348,028 | $664,023 | $282,056 |
NOI excludes debt service (principal and interest), capital expenditures and depreciation. Debt service uses current scheduled payments.
Forecast assumptions
ScenarioApplied to T12 actuals to produce the next-12-month forecast. Historical actuals are never changed.
- Forecast NOI
- $1,453,381
- Forecast DSCR
- 1.86x
- CF after DS & capex
- $634,360
- Value at exit cap
- $20,046,641
- at 7.25%
Source documents
- Bayshore_T12_Sep2026.pdfNeeds review
Demo monthly figures are sample records; document values have not been extracted automatically.